Mittwoch, 5. August 2015

Global MMOG/LE: an example how a standardized supplier evaluation can be used for assessing risks

The automotive industry is one of the most important industries for Germany (and also in many other industrial countries worldwide). For logistics and supply chain management, there arise certain requirements due to the increasing number of derivate products that lead to a further rising complexity of the global supply chain. Additional challenges exist due to changes in supply markets and due to volatile regional demand markets.

Against this background of this trend, supplier management serves as an approach to guarantee an effective supply chain. One element of supplier management is supplier evaluation, which generates information for the selection of new suppliers and for the development of current suppliers. To keep the effort for a supplier evaluation low, companies in the automotive sector developed a standardized evaluation approach. For this development, Odette International and Automotive Industry Action Group (AIAG) worked strongly together. The approach had been published as ‘Global Materials Management Operations Guideline/Logistics Evaluation’ (in short: Global MMOG/LE), and is available in various languages as a tool for Microsoft Excel.

The objectives of the Global MMOG/LE are:
  • “Produce a common SCM evaluation that can be used by all business partners, both internal and external.
  • Establish the components of an SCM system for suppliers of goods and services within the automotive industry […].
  • Enable SCM continual improvement plans to be developed and prioritized, thus enabling time to be spent on those activities that offer the greatest benefit.
  • Provide a basis for benchmarking activities and identify ‘Best Practice Criteria’ of SCM processes for driving continual improvement plans.” (AIAG, Odette: GLOBAL MMOG/LE – Introduction and Instructions, 2014.)
 The evaluation is structured into 6 chapters:
  1. Strategy and improvement
  2. Work organization
  3. Capacity and production planning
  4. Customer interface
  5. Production and product control
  6. Supplier interface
For the 197 questions (or better: criteria) of the Global MMOG/LE there exists some prioritization:
  • F1 criteria have the lowest importance. ‘Complying with F1 criteria contributes to the organization’s long-term sustainability and/or competitiveness.’ (AIAG, Odette: GLOBAL MMOG/LE – Introduction and Instructions, 2014.)
  • ‘If an F2 criterion is not met, the organization’s performance and/or customer satisfaction may be seriously affected.’ (AIAG, Odette: GLOBAL MMOG/LE – Introduction and Instructions, 2014.)
  • F3 criteria focus on fundamental requirements for business processes. ‘If an F3 criterion is not met, there is a high risk of interruption and/or incurring increased costs to the organization's and/or customer's operations.’ (AIAG, Odette: GLOBAL MMOG/LE – Introduction and Instructions, 2014.)
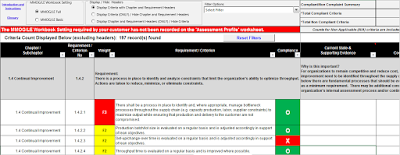
Figure 1 – Global MMOG/LE’s assessment sheet (screenshot from the Microsoft Excel-based 'Global MMOG/LE')


Figure 1 shows a screenshot of the assessment sheet of the Global MMOG/LE tool. It indicates the importance of the criteria by different colors (white, yellow, and red). It also shows met and unmet criteria by using green and red background color.

In chapter 2, you can find a sub-chapter, that explicitely deals with ‘risk assessment and management’. However, in each chapter one can identify questions that show a link to risk and risk management. But let’s look at chapter 2 first.

Table 1 lists criteria of sub-chapter 2.5, which explicitly focuses on risk assessment and management. The importance of risk management immediately becomes by realizing that 3 out of the 7 criteria are F3 criteria – and thus are essential for a company’s performance. One of the F3 criteria evaluates the existence of a process for risk assessment, the other two F3 criteria focus on emergency plans. It is important to note, that if any F3 criteria is not met, the supplier will automatically be ranked as a C supplier (the lowest and not achievable rank).


Table 1: Risk-related criteria from sub-chapter 2.5 (source: AIAG, Odette: GLOBAL MMOG/LE, 2014)


Beside sub-chapter 2.5, there are more criteria that explicitly or implicitly focus on risk and risk management. Some of those criteria are listed in table 2. Again one can realize that most of the criteria are of F2 or F3 type.


Table 2: Selected further risk-related criteria (source: AIAG, Odette: GLOBAL MMOG/LE, 2014)


Let us sum up the findings from using the Global MMOG/LE:
  • The Global MMOG/LE had been developed as an industry-wide standard for logistics evaluations. This purpose is satisfied to a high degree.
  • The structure of the catalogue of criteria is not intuitively understandable. For example, if it had followed the widely used SCOR model, there had been a better structured basis for the assessment. (See, for example, the post on using SCOR for risk management in the electronic industry in a post from November 2014.)
  • Risk management is covered both explicitly and implicitly. On the one hand, there is sub-chapter 2.5, which lists seven criteria (three of them F3 criteria), that explicitly cover risk management topics. On the other hand, one can identify a large number of questions in other chapters, that also deal with risk and risk assessment.
  • Global MMOG/LE does not explicitly identify risks. It rather lists criteria that should lead to an effective risk management.

A big ‚thank you‘ goes to Sascha Gröbel from the VDA for supporting this short article by giving me access to the Global MMOG/LE.

A longer version of this blog entry will be published (in German) in the upcoming book by Michael Huth and Frank Romeike: Risikomanagement in der Logistik: Konzepte – Instrumente – Anwendungsbeispiele, Springer 2015.

Mittwoch, 18. März 2015

Our number one is... Supply Chain Risks! (But beware of Cyber Crime!)

Business interruption and supply chain risks are - by far - the most important risks for managers. Cyber risks on the other side made a significant jump into the top 10 business risks. That is the bottom line of the 'Allianz Risk Barometer - Top Business Risks 2015', published in January 2015 (see press release and downloadable files here: http://www.agcs.allianz.com/about-us/news/press-riskbarometer2015/). For the study, Allianz (Allianz Global Corporate & Specialty, or in short: AGCS) asked more than 500 managers from 47 countries, with a focus on the corporate insurance sector for both large industrial and mid-sized companies. (The term mid-sized companies, however, is in some way misleading, since it does not match the categorization by the European Union. In the Allianz survey, mid-sized companies are defined by a revenue of not more than 250 million Euros.)

Figure 1: Top Business Risks 2015. Source: Allianz Global Corporate & Specialty: Allianz Risk Barometer 2015 Appendix, http://www.agcs.allianz.com/assets/PDFs/Reports/Allianz-Risk-Barometer-2015_Appendix.pdf.

As show in figure 1, almost half of the respondents mentioned business interruptions (BI) and supply chain (SC) risks as a top risk (46 % - after 43 % in 2014). More specifically, those risks are crucial for manufacturing companies; in this industry BI and SC risks had been mentioned by more than two third (68 % - after 60 % in 2014).

On one hand, this results are accompanied by an increasing awareness of such risks and their consequences for an enterprise's business. As Mark Mitchell, Regional CEO for Asia at AGCS puts it: "Companies now have a greater understanding of the need to monitor risk aggregations, not just geographically, but also in business interruption exposures." On the other hand, AGCS identified crucial discrepancies between the awareness and actual measures and systems to prevent companies from those risks. The study states: "[...] adequate [...] business continuity management remains a gap in many multinational companies' supply chain risk management programs." And: "Interdependencies between suppliers is often a big unknown. Many businesses still do not have alternate suppliers."

One of the big 'movers' (or should we say: one of the 'rising stars'?) are cyber risks. While two years ago, cyber risks were ranked 15th (with 6 % of the respondents mentioning this type of risk), the importance of cyber risks has grown steadily: In 2014, those risks were ranked 8th, listed by 12 % of the companies. In 2015, cyber risks were mentioned as a top risk by every 6th company (17 %), and were ranked 5th. Cyber risks are ranked 2nd in Germany (32 %), 3rd in the UK (30 %), and 3rd in the US (26 %). And: cyber risks are seen as no 1 risk for the next five years.

Figure 2: Top risks for which businesses are least prepared. Source: Allianz SE/Allianz Global Corporate & Specialty SE: Allianz Risk Barometer - Top Business Risks 2015, http://www.agcs.allianz.com/assets/PDFs/Reports/Allianz-Risk-Barometer-2015_EN.pdf

However, cyber risks are crucially underestimated. 73 % (that's almost 3 out of 4 companies!) of the companies say, the risk of cyber crime is underestimated. Even worse, more than half of the companies (54 %) has not even analyzed the problem! As a consequence, 29 % of the enterprises admit not to be sufficiently prepared for cyber risks, while for other risks this number is significantly smaller (see figure 2). The most feared cyber risk is data theft and manipulation (64 %), followed by loss of reputation (48 %) and increased threat of persistent hacking (44 %).

It is interesting that a shortage of skilled talents in combination with an aging workforce is not seen as a major risk. Exceptions from this observation: This risk seems to be relevant for Australia and the USA - in those two countries, talent shortage/aging workforce are ranked within the top 10 risks.

Figure 3: Top risks for the long-term future (5 to 10 years 'plus'). Source: Allianz SE/Allianz Global Corporate & Specialty SE: Allianz Risk Barometer - Top Business Risks 2015, http://www.agcs.allianz.com/assets/PDFs/Reports/Allianz-Risk-Barometer-2015_EN.pdf

In a long-term perspective, climate change is identified as the most concerning risk, directly followed by natural catastrophes (see figure 3). This is understandable, since at least the financial lossed resulting from natural catastrophes have increased dramatically over time.

Donnerstag, 20. November 2014

SCRM in the electronic industry – an industry recommendation

A few days ago, the ZVEI, the German Electrical and Electronic Manufacturers’ Association, published an industry recommendation how to set-up and run Supply Chain Management in the electronic industry. The recommendation ‘Guideline Supply Chain Management in Electronics Manufacturing’ is the result of an initiative started by two divisions of ZVEI – the Electronic Components and Systems Division and PCB and Electronics Systems Division. The reason that these two division started the initiative is simple: The members of those two division are located upstream in electronic supply chains – and therefore they face stronger consequences of the well-know bull-whip effect (volatility of demand, out of stock situations etc.). Thus, these companies are highly interested in establishing SCM in their supply chains to reduce the bullwhip effect and to decrease the level of risk.

The document addresses different topics of SCM: It starts with a general introduction into Supply Chain Management, then discusses robust supply chains, focuses on external framework conditions, and gives recommendations for education and training in SCM. From an SCRM perspective, chapter 2 (‘Robust Supply Chains with High Responsiveness and Flexibility’) is of special importance.


Figure 1: List of possible risks for different process types. Source: ZVEI - German Electrical and Electronic Manufacturers’ Association: Guideline Supply Chain Management in Electronics Manufacturing, Frankfurt/Main 2014.

The ZVEI starts with defining robustness in supply chains: “This means that a robust supply chain must be as reliable and immune as possible to external influences and risks, possibly intercepting errors when they occur to minimise their impact on downstream processes.” The document then lists different risks that might occur in various areas of the supply chain. The underlying concept is the well-established SCOR model, the ‘Supply Chain Operations Reference’ model, which is a set of standard processes on different levels, which can be used to model, document, and analyze supply chains. Following the SCOR approach is one of the strengths of the document. By applying SCOR to the SCRM process means to build a solid structure for risk management. Figure 1 shows the result of the generic risk identification using SCOR model – a table with potential risks, that are assigned to the 5 different types of processes used in the SCOR approach. (The ‘return’ process was omitted intentionally, since the group found it played a minor role.)

After identifying and listing various risks in the electronic supply chain, the document focuses on measures to safeguard against risks. Again, when suggesting and discussing different approaches, the document follows the SCOR model. Those measure contain suggestions that are typical to SCM, such as supplier management and the use of SCM IT applications. On the other hand, risk management specific approaches are suggested, such as FMEA and the simulation of supply chain scenarios. It also recommends the use of a risk classification matrix.

Figure 2: Questionnaire. Source: ZVEI - German Electrical and Electronic Manufacturers’ Association: Guideline Supply Chain Management in Electronics Manufacturing, Frankfurt/Main 2014.

The paper not only lists risks and possible counteractions, but also addresses the organizational implementation of risk management. Within a few pages, the paper gives valuable hints for setting up a risk management in supply chains, and also focuses on communication in risk management. Additionally, the document provides a questionnaire that helps to ask the right questions in SCRM in the electronic industry (see Figure 2).


We Germans would probably ask: Aren't there any weaknesses of the paper? And then we would answer: Yes, there are some. But: I don't want to focus them - because I would like to look at the recommendations' strengths. So: Is the paper helpful? Definitely! One of the strengths is to give an overview over SCM and SCRM in a specific industry. Of course, this leads to some general suggestions and recommendations (as mentioned above), but those recommendations still focus on the electronic industry. (And if you ever worked on industry standards, you for sure know how difficult it is to find a compromise even for definging single termns.) Another strength is to link SCRM activities to an existing, structured approach – the SCOR model. The SCOR approach thus builds the framework for identifying, evaluating and managing supply chain risks. By following SCOR the paper shows a strong methodic structure, that can be followed easily!

The document ‘Guideline Supply Chain Management in Electronics Manufacturing’ can be downloaded from the ZVEI’s homepage: http://www.zvei.org/en/association/publications/Pages/Guideline-Supply-Chain-Management.aspx.

Freitag, 7. November 2014

DHL's Swiss knife revisited

More than a month ago, I discussed DHL's risk management approach that resulted in DHL Resilience360. I concluded that the approach seemed to be interesting, but the available information was shallow.

I tried to get in contact with DHL to find out more about this tool, and - after a first unsuccessful attempt - I was invited to either visit DHL in Troisdorf or to follow a live presentation via WebEx. To save resources, I chose the latter - and eventually we set a date for the presentation.

To start with my overall impression: The tool and its capabilities are impressing. There might be aspects, where you could argue, that the methodic foundation might be weak. But, from my point of view, the tool offers much more than I dared to expect.

Figure 1: Visualization of a global supply chain, including risk assessment of the supply chain elements

Strategic level: supply chain visualization and risk assessment of the (static) supply chain


The application provides two general functionalities: On one hand, it supports the supply chain configuration on a strategic level. By a geo-referenced visualization of the whole supply chain, i.e. all own suppliers' and customers' locations, and infrastructure nodes plus all relations between those nodes, it provides a worldwide overview  (see figure 1 above). From a conceptual point of view, the visualization of a supply chain is nothing extraordinary. However, the practical implementation of a worldwide visualization is at least a first step to create some visibility. And - visibility is one of the key words to implement an effective SCRM. The transportation links also reflect the actual route of a shipment, so again, the data is geo-referenced.

Figure 2: Detailed risk assessment of a node within a supply chain ('risk scores')


Each node and each link has additional risk-related information. Those information can be collected by semi-automatically sending out questionaires with risk-relevant questions to the operators of the facilities. The answers are then used as input into a risk assessment, so that a number of different risk factors can be evaluated focusing on exposure, impact, and severity. The algorithm that calculates the risk values has not been discussed, so that might be an open issue. Nevertheless, the values offer the risk manager a first idea where 'hot spots' in terms of high risks might exist - and why those locations might be hot spots (see Figure 2). They also indicate, where to develop measures to manage risks.

Figure 3: Country-focused risk evaluation


The risk assessment on the strategic level can be additionally supported by a country-focused risk evaluation (see figure 3). Those information are based on a number of different sources. They do not only reflect the current risk situations for different factors such as terrorism, corruption, or cargo theft, but also give the risk manager an idea regarding the risk trends for the aforementioned factors. Of course, this feature of the application does not generate a 'WOW!'. But - it can effectively support the supply chain (risk) manager because it is part of an integrated system.

Figure 4: Risk monitoring using geo-coded near-time incident data


Operational level: Incident monitoring


The second functionality of Resilience360 is an almost real-time (thus 'near-time') risk monitoring. It is a 'near-time' monitoring, because the (currently five) providers of risk-related incident information, such es data on strikes, terror attacks, environmental changes, delays, etc., first validate the data and their sources, so the information can be confirmed. The risk news are also geographically referenced, so they can be displayed on the map in the system (see figure 4).

Figure 5: Matching incident data and supply chain characteristics to identify affected supply chain elements


To realize, how those incidents might influence the supply chain, the user can define some kind of 'influence area' for the incident. By matching the geo-referenced 'influence area' with the also geo-referenced supply chain, the supply chain risk manager can immediately identify affected parts of the supply chain (see figure 5). Thus, this functionally can effectively support the operational risk monitoring even of complex supply chains.

The functionality explained above, i.e. the strategic supply chain mapping including risk-related information and the operational risk monitoring of supply chains and their processes, are - I must admit - impressive. The online and browser-based application can be used almost intuitively. The functionality seems to incorporate a lot of practical ideas and methodological aspects.

Data availibility is a crucial point


Aren' t there any limitations? Yes, there are. It's the required data that defines if the application is helpful or not. The incident data is provided by external sources - so that should not be a problem of availability. It should also not be a problem to get location-related data of own facilities. But, it is getting more and more difficult the more a company tries to integrate supplier and customer data. And the data availability will be worse when it comes to integrating tier-2 or tier-3 suppliers (or customers of customers). This is not only true for the static data, i.e. locations, relations, and risk data, which might be difficult to compile. The situation get worse when dynamic data such as actual shipment data is required for the operational risk monitoring. Again, the data acquisition might be easy when the company has full responsibilities for shipments, and thus has the shipment data. (Alternatively, if DHL is the LSP for the company, DHL should be able to provide all detailed shipment data.) But, if some third party is responsible for planning and control of shipments, it seems unlikely to get hold of the data. This is, of course, not a problem of the tool, but it is a crucial point for the applicability of DHL Resilience360.

As mentioned above, the calculation of the risk values for exposure, impact and security is - at least to me - a black box, so an evaluation of the methodology is not possible.

Wish list of supply chain risk managers


Risk managers might have some points on their wish list. This could be the assessment of follow-up risks, based on a current incident somewhere in a supply chain. If the tool would be able not only to identify those parts of the supply chain that are directly affected but could also calculate or estimate the consequences for later processes in the supply chain, it would be of great help for a consequences analysis and for prioritizing counteractions. Another wish could be a stronger decision support. Currently, the application works as management information system (MIS), that provides data for a supply chain (risk) manager. However, generating alternatives, such as chosing alternative routings, or shifting production from one location to another, is a task carried out by the manager. If the system could simulate alternative routings, or the consequences of changing production and delivery plans, the manager could focus on evaluating those alternatives and then choose the optimal alternative. This would shift the application to a decision support system (DSS).

Summary


Beside those aspects mentioned above, the DHL's Resilience360 is a very strong and - as it seems - highly sophicasted tool that support strategic and operational tasks in supply chain risk management. It provides much more functionality than other tools available. However, the question of gathering enough and high-quality (i.e. detailed) data from all supply chain partners is a crucial point for the tool.

(All screenshots by courtesy of Deutsche Post AG.)

Dienstag, 30. September 2014

Don't play it safe...

'Don't play it safe when it comes to Supply Chain Risk Management' - that is the title of Accenture's new 'global operations megatrends study'. The analysist at Accenture took a look at SCRM to identify the current top risks for supply chains and also the functions or areas within a supply chain that seem to be most at risk. Accenture also aims to highlight some best-practices top companies are implementing when it comes to setting-up and effective SCRM.Thus, let's take a look at the results of the study...

The respondents that were contacted within the survey are more than 1,000 senior managers; most of them are from large global companies from all over the world.

Figure 1: Greatest sources of supply chain risk, source: Accenture: Don't play it safe when it comes to Supply Chain Risk Management, 2014, p. 5.

When focusing on the top souces for supply chains risks, the study shows that the most important risk  source is IT (see figure 1). Two contributing factors are mentioned: On one hand, companies have failed to set-up agile IT organizations that can quickly react to market demand changes. On the other hand, too much data is insufficient or even missing or not accessible - leading to a still low level of visibility within the supply chain. Disasters, however, although often leading to high negative consequences, are not ranked as a top risk - probably due to their low probability of occurrence.

Figure 2: Approaches to risk management, source: Accenture: Don't play it safe when it comes to Supply Chain Risk Management, 2014, p. 6.


More than 75 % of the companies see operational risk management as important or even very important. This importance can be seen in the different approaches to risk management (see figure 2). The most important approaches are having a risk management in place, the use of alternative partners when needed, and the use of IT and organization to reach a visibility regarding risks. It is interesting and seems contradictory that approaches to visibility are mentioned as some risk management measure, whereas there is still a high degree of intransparency in supply chains - as mentioned above in the sections on top risks.

Accenture reports about very promising quantitative results of risk management, which can be measured by the return on investment (ROI). 21 % of the companies reached an ROI of between 51 % and 100 % from their investments in SCRM. Another 7 % of the enterprises are proud to have an ROI of even more than 100 %. However, the the question remains, how an ROI from specific actions can be measured without taking into account additional influences (from outside risk management activities).

Accenture's analysts identified three key practices that support and enhance the effectiveness of SCRM:
  1. Leaders (the abovementioned group of companies with an ROI of more than 100 %) take care that SCRM gets a top priority in a company. They support this approach by installing a risk management officer, by developing SCRM skills of employees, and other practices.
  2. Leading companies show a higher degree of centralization when it comes to SCRM. 43 % of the leaders have a centralized risk management, whereas only 37 % of the other companies have risk management centralized.
  3. Leaders are considerably investing into SCRM, especially to increase the end-to-end visibility within the supply chain. 60 % of the leaders increase their investments in this area by more than 20 %. Only 23 % of the other companies have planned such high investments.

The study shows interesting results. It can be used to promote SCRM in an enterprise. Also, some best-practice approaches are mentioned. On the other hand, since most of the respondents are managers from large companies, it is not clear if those results would hold true also for small and medium enterprises. Also, the identification of 'leaders' by the ROI on SCRM-related investments seems to be at least questionable. This also concerns some of the best-practice approaches (especially the question of centralization/decentralization of SCRM).

The full study 'Don't play it safe when it comes to Supply Chain Risk Management', published by Accenture in 2014, can be downloaded from Accenture's website: http://www.accenture.com/SiteCollectionDocuments/PDF/Accenture-Global-Megatrends-Operations-Supply-Chain-Risk-Management.pdf

Donnerstag, 18. September 2014

DHL's Swiss Knife?

Supply chains are extremely complex constructions. That has implications for SCRM: Due to the multi-tier character of supply chains with many thousands transactions (material, information, and financial flows) the detection of risk developments in operations is difficult. Because a broad variety of operational databases and applications is used, transparency regarding the abovementioned flows is almost impossible.


Figure 1: Visualization of a company's supply chain, Source: http://www.dpdhl.com/content/dam/presse/img/2014/dhl-resilience360-world-map-600.jpg

DHL now promises to solve ‘mission impossible’ by the introduction of ‘Resilience360’. Resilience360 is said to allow for a holistic view and the real-time identification of possible risks. The application also suggests alternatives or counteractions for identified risk; thus, it seems to be a decision support system. This and more information can be found on www.dhl.com/Resilience. The site promises a lot. So far, many of the information are of relatively generic character. Also, the video shown on the DHL’s website is a nicely computer-animated movie, but contains little concrete information.

DHL also provides two case studies: The first focusing on the use of Resilience360 at ZF, one of the big automotive suppliers; the other talking about how Resilience360 has been used at DuPont. Again, many generic topics are mentioned in the case study, so the level of detail is (understandably) low. However, it is irritating that some identical pictures are used in both case studies.

Risk categories used for Resilience360, Source: http://www.dpdhl.com/content/dam/presse/img/2014/dhl-resilience360-risk-wheel-600.jpg

In the end, we only get a shallow first impression of this ‘all in one solution’ by DHL. Too much information is of generic character. The functionality seems to be impressive, but not much details were revealed (for example, no real screenshots were shown). Thus, an evaluation of the capabilities of Resilience360 is not possible. Another question that has not been addressed in the reports is how the data sources are included: If a global player like DuPont or ZF intends to gain more transparency, they must collect a huge amount of data and integrate not only direct suppliers, but partners on each level of the supply chain. It would be interesting to understand, if and how those difficulties are solved by Resilience360.

Sources:

Dienstag, 9. September 2014

Risk Management is a waste of time! And of resources. And of effort. And of money. And...

Very often, the benefits of risk management are underestimated. Or, managers do not see any benefits of using risk management for their company. Statements as "Risk management only creates additional cost" or "Risk management does not create any revenues" are often heard. (Personally, I read such statements quite frequently, when receiving answer sheets within our empirical research projects.) This statements are then used as arguments for not spending effort, time, and money to set-up or develop risk management. Very well done!

But: The view mentioned above is proven to be wrong! Aon plc., together with Wharton School of the University of Pennsylvania, have developed a so-called 'risk maturity index' (details can be found on Aon's website). The latest report on the risk matury index, which uses data from more than 360 publicly traded companies, shows some interesting results - especially when focusing on the benefits of risk management.

Risk maturity classification
Figure 1: Risk Maturity Classification; Source: Bourdon, T. W.: Aon Risk Maturity Index - Insight Report, November 2013, p. 6.

Based on a set of 40 different criteria, companies were classified by their answers into 9 different categories (see Figure 1). Only .7 % of the companies reached the maximum of 5 points on the index, and were classified as 'advanced'. However, more than 50 % of the companies show unsufficient capabilities for risk management - and are classified as 'basic' or 'initial/lacking'.

Stock Price Volatility by Risk Maturity Rating
Figure 2: Stock Price Volatility by Risk Maturity Rating; Source: Bourdon, T. W.: Aon Risk Maturity Index - Insight Report, November 2013, p. 63.

Figure 2 shows, that in general there is a negative correlation between risk management maturity and the stock price volatility. Thus, companies with a state-of-the-art risk management fear far less volatility of their stock price than companies with a 'basic' or 'initial' risk management.

Implications of the Greek Fiscal Crisis 2010
Figure 3: Implications of the Greek Fiscal Crisis 2010; Source: Bourdon, T. W.: Aon Risk Maturity Index - Insight Report, November 2013, p. 5.

It seems obvious that economic problems in a country or a region have implication on the profitability of companies. Thus, enterprises are affected by economic crisis. However, the report shows, that companies with a sophisticated risk management system in place are less affected by such a crisis than companies with a low risk maturity index. Figure 3 shows results focusing on the implication of the Greek fiscal crisis in 2010 for the stock price of enterprises. Again: The study shows, that a well-implemented risk management contributes strongly to the economic situation of a company.

Implications of the Japanese Earthquake 2011
Figure 4: Implications of the Japanese Earthquake 2011; Source: Bourdon, T. W.: Aon Risk Maturity Index - Insight Report, November 2013, p. 5.

Those statements also hold for the implications of catastrophes for companies. Figure 4 demonstrates how enterprises with a well-established risk management are far better off after the Japanese earthquake in 2011 than companies with a less developed risk management. In this case, we can also see how risk management can contribute to more or less stable and resilient supply chains.

The report 'Aon Risk Maturity Index - Insight Report, November 2013', written by T. W. Bourdon et al., can be downloaded from Aon's website: http://www.aon.com/risk-services/thought-leadership/report-rmi-insight-nov-2015.jsp.